Bently Nevada’s combined cycle brochure documents two balance-of-plant cases that rarely reach the top of a maintenance agenda. A plant had lost more than USD 300,000 to cooling tower fan problems before it installed permanent vibration monitoring; in one cited event a blade sheared off completely and the resulting unbalance destroyed the entire fan assembly and parts of the tower. At another combined cycle plant, System 1 trending of bearing and seal vibration on four cooling water pumps, collected in three-month snapshots, showed no sign of deterioration, so an OEM-recommended two-year inspection interval was extended to three years. The two cases work on different timescales: one is event protection, the other is interval extension. Both depend on the same discipline — fixed measurement locations, comparable data, and a written rule for what triggers action.
By TenBN Editorial Team · Updated November 1, 2026 · 13 minute read
Quick answer: what did permanent monitoring change?
Permanent monitoring changed the consequence of a failure and the timing of a maintenance decision. On the cooling tower fans, continuous measurement replaced a combination of simple vibration switches and a monthly portable route, and the brochure reports that no further failures occurred after permanent systems were installed. On the cooling water pumps, repeatable three-month vibration snapshots gave the plant evidence to move from a two-year OEM inspection cycle to a three-year cycle without finding deterioration.
The important distinction is that neither result came from buying more sensors alone. The fan result came from coverage — measuring continuously at the right locations. The pump result came from comparability — taking the same measurements, at the same points, under comparable operating conditions, often enough to see a trend. A permanent system with poor sensor placement, or a snapshot program with changing load and speed, can produce data that looks impressive and supports no decision.
The two documented cases at a glance
| Asset | What the brochure documents | Monitoring change | Reported result |
|---|---|---|---|
| Cooling tower fans | More than USD 300,000 lost to cooling tower fan problems before permanent monitoring. In one instance a blade sheared off completely; the unbalance destroyed the entire fan assembly and parts of the tower. Simple vibration switches were installed and a portable data collector was used monthly. | Permanent vibration monitoring installed on the fans. | No further failures after permanent monitoring was installed. The brochure does not state the observation period. |
| Cooling water pumps (four) | OEM recommended that bearings and mechanical seals be inspected every two years. | System 1 used to monitor bearing and seal vibration, with data collected in three-month snapshots. | No sign of deterioration; the maintenance period was extended by one year, to a three-year cycle versus the two-year OEM recommendation. |
Both cases are vendor-published and the plants are not named. That does not make them unusable — the failure mechanism and the decision logic are specific enough to transfer — but it does mean the figures should be read as reported outcomes, not as audited benchmarks. The brochure also does not publish the fan size, the number of towers, the monitoring channel count, the inspection cost, or the length of follow-up. Those gaps matter when you build a business case, and they are addressed later in this article.
Why a cooling tower fan failure costs more than a fan
A cooling tower fan is a balance-of-plant asset until the plant is running at or near design limits. At that point, losing even one tower can curtail output. The brochure makes this point directly: when operating at or near design performance limits, loss of even a single cooling tower can curtail plant output. The repair cost is only the first layer of the loss.
The second layer is secondary damage. A fan blade that releases does not simply disappear. The remaining blades are suddenly out of balance, and the resulting unbalance loads the shaft, bearings, hub and support structure. In the cited event, the unbalance destroyed the entire fan assembly and parts of the tower. That turns a blade replacement into a fan rebuild and a structural repair, often with scaffolding, crane time and a tower outage.
The third layer is timing. Cooling towers are most valuable on hot days, when the plant is closest to its output limit and when a forced outage is most expensive. A repair that would be routine in a mild season can become a capacity event in summer. The brochure does not itemize these layers, but its warning about curtailment and its description of the damage are consistent with them.
The fourth layer is the failure location itself. The brochure singles out the speed-reducing gearbox as a particularly vulnerable failure location that warrants vibration monitoring. A gearbox failure can release debris into the oil system, damage the fan shaft, and extend the repair beyond the gearbox. Monitoring the gearbox is not optional if the goal is to avoid the full chain of damage.
Why vibration switches and monthly routes missed the blade failure
The most useful sentence in the cooling tower case is the one about what was already installed: simple vibration switches and a monthly portable data collector. This was not an unmonitored fan. It had protection and it had a route. The blade still sheared off and the fan still destroyed itself.
A simple vibration switch is usually a single-setpoint device. It measures an overall level and changes state when that level crosses a threshold. That is useful for tripping a machine before catastrophic vibration, but it provides no trend, no spectrum and no phase. It cannot distinguish a growing imbalance from a bearing defect, and it cannot warn about a cracked blade until the imbalance is large enough to move the overall level. If the setpoint is raised to avoid nuisance trips, the warning window narrows further.
A monthly portable route has different limits. It measures at intervals, so the interval becomes the blind spot. A fatigue crack can grow from initiation to blade release in less time than the route cycle, particularly on a fan that sees alternating loads and speed changes. Portable measurements are also affected by conditions: fan speed, wind, tower load, sensor placement and coupling condition all change the spectrum. A route that produces a clean trend at one speed can produce a confusing one at another.
Permanent monitoring closes both gaps. It measures continuously at fixed locations, so the time between samples is short and the sensor position does not change. It can capture short transients that a monthly route never sees, and it can trend orders such as 1X and blade pass against speed. That is what turns a blade crack from an invisible condition into a trend that can be acted on.
| Measurement approach | What it can see | Blind spot exposed by the cited case |
|---|---|---|
| Simple vibration switch | Overall vibration above a setpoint; often wired to trip or alarm. | No trend, spectrum or phase. Warns only after the overall level has already risen; the setpoint may be set high to avoid nuisance trips. |
| Monthly portable route | Periodic overall and spectral data at bearing housings. | A 30-day gap can exceed the growth time of a blade crack. Speed, load, wind and sensor placement change between visits. |
| Permanent online monitoring | Continuous trend, spectrum, transient capture and speed-referenced orders at fixed points. | Requires correct sensor locations, a speed reference, and alarm limits that are tuned to the machine rather than copied from a sister unit. |
What permanent monitoring measures on a cooling tower fan
A cooling tower fan train usually has four measurement zones: the motor, the gearbox, the fan shaft or hub bearing, and the structure that carries them. The first three are the priority. The structure is useful for confirming resonance or looseness but is rarely the first indication of a blade problem.
At the motor, measure both drive-end and non-drive-end bearings. Velocity is the practical unit for bearing-housing vibration and for imbalance and misalignment; acceleration is better for early rolling-element defects and for gear mesh. At the gearbox, acceleration is the primary measurement because gear mesh and bearing defect frequencies sit at higher frequencies than the shaft orders. At the fan bearing or hub, velocity is the primary measurement for imbalance, and a speed reference is essential for interpreting it.
The speed reference deserves its own paragraph. Without a tachometer or keyphasor, a spectrum is just a set of frequencies. With a speed reference, the same data becomes orders: 1X, 2X, blade pass and gear mesh. That matters on a fan because blade pass frequency is a function of fan speed and blade count, and because a blade problem often appears as a change in the relationship between 1X and blade-pass energy rather than as a simple rise in overall vibration. A keyphasor also lets the system normalize data to a common speed, which is what makes trend comparison honest when the fan operates over a range.
| Failure mode | Typical vibration signature | Practical measurement |
|---|---|---|
| Blade crack, blade loss or pitch change | Rising 1X imbalance, blade-pass sidebands, transient events | Velocity at the fan bearing or hub, with a speed reference for order analysis |
| Deposit or ice imbalance | 1X, sometimes with a slow change over hours or days | Velocity at the fan bearing |
| Gearbox gear wear or misalignment | Gear mesh frequency and sidebands, rising high-frequency energy | Accelerometer on the gearbox housing |
| Gearbox bearing defect | Bearing defect frequencies, often visible first in envelope or high-frequency bands | Accelerometer with high-frequency or envelope processing |
| Motor bearing defect | High-frequency acceleration, later rising velocity and noise | Accelerometer at both motor bearings |
| Misalignment or looseness | 2X and harmonics, axial components, phase changes | Velocity and phase at bearing housings |
| Oil whirl or instability (sleeve bearings) | Subsynchronous component, sometimes unstable | Proximity probes, where the bearing design uses them |
Choosing hardware: 1900/65A, 2300/20, or 3500
There is no single correct platform for a cooling tower. The choice depends on criticality, channel count, the plant’s installed standard and how the data will be used. The three Bently Nevada options below cover most balance-of-plant cases, and they can coexist on the same site.
| Option | Capacity and outputs | Best fit | Watch-outs |
|---|---|---|---|
| 1900/65A | Four configurable channels; acceleration, velocity or displacement inputs; 4–20 mA and relay outputs; local color display; SIL 2. | One fan with four points, or a small group of balance-of-plant machines. Stand-alone installation without a 3500 rack. | Four channels fill quickly if you want motor DE and NDE, gearbox input and output, plus a fan bearing. Prioritize points before specifying. |
| 2300/20 | Two dynamic channels plus a speed input; Modbus communication; display; relay outputs. | Smaller fans or pumps, package skids, and applications where a compact monitor with speed is enough. | Two dynamic channels per unit means one unit per bearing pair; count the units before comparing cost. |
| 3500/42M with 3500/25 | Four vibration channels per 42M card; two keyphasor channels per 25 module; switchable displacement, velocity or acceleration; four-level alarms; SIL 2 and hazardous-area certifications. | Critical fans, plant-standard racks, and sites that want protection and condition data in the same architecture. | Requires a rack, power supplies, a communication gateway and engineering time. The platform is justified by criticality and standardization, not by channel count alone. |
A 3500 architecture for fans normally pairs the 3500/42M with the 3500/25 keyphasor module, a 3500/92 communication gateway for Modbus, and a 3500/22M transient data interface when event capture is required. The rack and power layer are the 3500/05 rack and 3500/15 power supply. The 3500 system guide explains how those modules fit together.
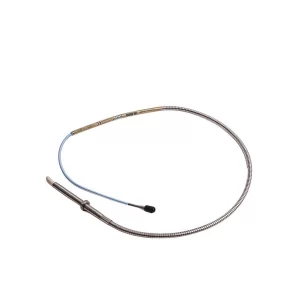
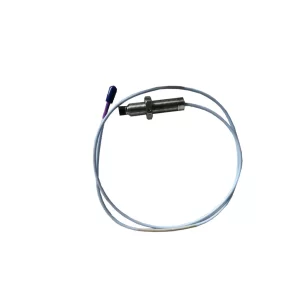
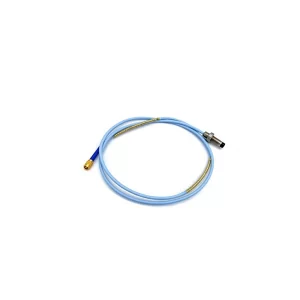
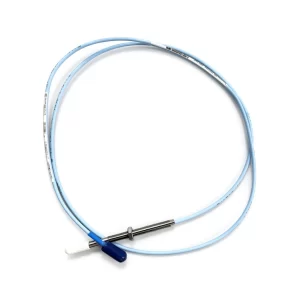
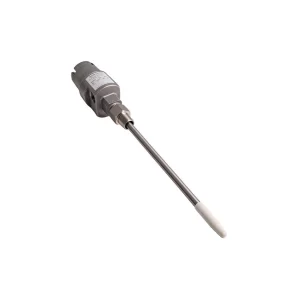
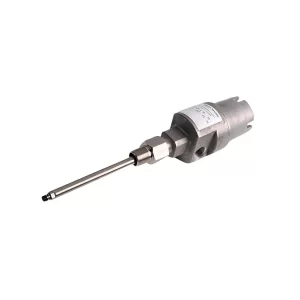
For the sensors, the 330500 Velomitor is a velocity sensor with 100 mV/(in/s) sensitivity and a usable band from 4.5 Hz to 5 kHz at ±3 dB, or 6 Hz to 2.5 kHz at ±0.9 dB. It is a practical choice for motor and fan bearing housings. The 330400 accelerometer covers 10 Hz to 15 kHz with 100 mV/g and 50 g peak, which is the range where gear mesh and early bearing defects appear. The compact 190501 Velomitor CT is another velocity option where space is tight. For pumps with sleeve bearings, the 3300 XL 8 mm probe and extension cable provide shaft-relative displacement; larger shafts may use the 3300 XL 11 mm probe.
Wireless and periodic options have a place for lower-criticality fans, and the brochure lists wireless vibration monitoring on cooling fans within the portfolio. The constraint is the sampling interval. Wireless is appropriate when the failure mode grows slowly relative to the measurement interval. It is a weaker fit for a blade crack that can propagate quickly, which is exactly the failure mode that destroyed the fan in the case.
The cooling water pump case: from two years to three
The second case is quieter but more directly reusable for maintenance planning. When the combined cycle plant went into commercial operation, the OEM recommended that the mechanical seals and bearings on four cooling water pumps be inspected every two years. Instead, on Bently Nevada’s recommendation, the plant used its System 1 software to monitor the bearing and seals, collecting vibration data in three-month snapshots. The data showed no sign of deterioration. The maintenance period was extended by one year, and inspections moved to a three-year cycle versus the OEM-recommended two-year cycle.
Several details are worth separating. First, System 1 is the software layer that stores, trends and displays the data; the brochure does not say whether the snapshots came from a portable collector, a wired online system or a wireless system. That matters because the confidence in an interval extension depends on the measurement method, not only on the software. Second, the scope was bearings and mechanical seals on four pumps, not the entire pump train. Third, the decision was an extension of one year, not an open-ended cancellation of inspections.
The pump measurements that support this kind of decision are broader than a single vibration value. Bearing condition is visible in velocity and high-frequency acceleration at the pump and motor bearings. Mechanical seal condition is often better indicated by seal leak-off flow or pressure, seal flush conditions and seal-housing vibration than by overall vibration alone. Bearing temperature and lube condition complete the picture. A three-month snapshot that captures only overall velocity is a weak basis for extending a seal inspection; a snapshot that captures the same spectral points under comparable head, flow and speed is a much stronger one.
| Check | Why it matters for a cooling water pump | Typical data source |
|---|---|---|
| Pump and motor bearing vibration | Detects rolling-element defects, looseness and misalignment before failure. | Accelerometers or velocity sensors; proximity probes on sleeve bearings. |
| Seal-housing vibration | A change can indicate seal face instability, cavitation or shaft motion. | Accelerometer or velocity sensor at the seal housing. |
| Seal leak-off flow or pressure | Direct indicator of seal condition and a leading sign of a leak on return to service. | Plant instrumentation or DCS trend. |
| Bearing temperature | Confirms mechanical and lubrication condition; catches rapid changes. | RTD or thermocouple via the monitor or DCS. |
| Operating point | Vibration is only comparable at similar flow, head and speed. | DCS historian; flow, pressure and speed tags. |
| Maintenance history | A recent seal replacement or alignment change resets the baseline. | Work order and commissioning records. |
How to extend an inspection interval without guessing
An interval extension is a reliability decision, not a monitoring decision. The monitoring provides evidence; the extension requires a rule that says how much evidence is enough and what would reverse the decision. The following table is a practical gate for a cooling water pump program. It is editorial guidance, not a Bently Nevada recommendation, and it should be adapted to the pump design and the plant’s risk tolerance.
| Gate | Pass condition | If the gate is not met |
|---|---|---|
| Data completeness | At least three consecutive snapshots at comparable speed, flow and head, with the same sensor locations and settings. | Keep the existing interval and fix the data comparability first. |
| Bearing trend | No sustained upward trend in 1X, 2X or high-frequency acceleration beyond normal scatter. | Investigate the bearing or alignment; do not extend. |
| Seal condition | Stable seal leak-off and seal-housing vibration; no step change after the last maintenance. | Inspect the seal at the next planned window. |
| Thermal condition | Bearing temperatures stable and inside the normal operating band. | Check lubrication, cooling and sensor health before deciding. |
| Operating envelope | No new cavitation, dry-run events, load cycling or suction restrictions. | Re-baseline and restart the evidence count. |
| Maintenance history | No recent seal replacement, re-alignment or impeller change that invalidates the baseline. | Re-baseline after the maintenance and wait for three clean snapshots. |
| Governance | Documented OEM agreement, a named owner and a rollback trigger. | Do not extend the interval. |
The rollback trigger is the part most programs omit. A useful trigger is a defined change in any of the primary indicators across two consecutive snapshots, or a single step change that exceeds the normal scatter band. Without a trigger, an extension becomes a permanent decision by default, which is how a good reliability program turns into a deferred inspection.
A channel plan for four fans and four pumps
The following plan is an illustrative configuration, not a reproduction of the brochure. It assumes four cooling tower fans with four points each and four cooling water pumps with four points each. The point count is deliberately conservative: it includes both motor bearings and both gearbox or pump bearings, because a single-point fan or pump is difficult to diagnose when something changes.
| Asset group | Points per unit | Channels and example hardware |
|---|---|---|
| Cooling tower fans (4 units) |
Motor DE, motor NDE, gearbox input, gearbox output or fan bearing | 16 dynamic + 4 speed Four 3500/42M cards and two 3500/25 modules; or four 1900/65A units. |
| Cooling water pumps, rolling-element bearings (4 units) |
Pump DE, pump NDE, motor DE, seal housing | 16 dynamic + 4 speed Four 3500/42M cards and two 3500/25 modules; or eight 2300/20 units. |
| Cooling water pumps, sleeve bearings (4 units) |
X and Y proximity probes at each pump bearing | 16 dynamic + 4 speed Four 3500/42M cards with 3300 XL probes and two 3500/25 modules. |
| Illustrative total (8 units) |
32 dynamic + 8 speed Two 3500 racks, or a hybrid of 3500 and stand-alone monitors. |
Two practical notes. First, speed channels are not always required. If the fan runs at a fixed speed and the pump speed is available from the VFD or DCS, the keyphasor count can be reduced; the trade-off is that order analysis and speed normalization become dependent on an external signal. Second, rack sizing is a separate exercise. The channel totals above do not include the transient data interface, the communication gateway, power supplies or spare slots, so confirm the slot count and power redundancy in the 3500/05 rack configuration before committing to a single rack.
What the other cases in the brochure show
The two balance-of-plant cases are part of a wider set of outcomes in the same brochure. They are useful because they show the same pattern across asset types: a measurement that is specific enough to diagnose a failure, combined with a decision that is made before the failure becomes an outage.
| Asset | Documented outcome | What made the difference |
|---|---|---|
| Gas turbines | Yearly fuel savings above USD 500,000 are described as not unusual with continuous thermodynamic performance monitoring. | Performance monitoring tied to efficiency and heat-rate KPIs, not vibration alone. |
| Steam turbine | USD 900,000 of lost production averted after a remote diagnostics engineer identified bearing-assembly looseness and confirmed the unit could stay online. | Remote access to the monitoring system plus a diagnostic decision, not just an alarm. |
| Boiler feedwater pump | USD 90,000 in contract penalties avoided when increased vibration was diagnosed and fixed without delaying startup. | Measurement during commissioning and return to service, when the machine is most vulnerable. |
| Generator | Shorted rotor bars diagnosed while the unit stayed online; the generator was rewound during a planned outage. | Vibration and electrical context used together to defer a repair without ignoring it. |
| European fleet, 25 years | Time between outages increased by 80%, outage durations decreased by 60%, and fleet availability increased by 3.5% compared with calendar-based maintenance. | A long-term condition-based program, not a single monitoring purchase. |
| Cooling tower fans | More than USD 300,000 lost before permanent monitoring; no further failures after installation. | Continuous coverage at fixed points, including the gearbox. |
| Cooling water pumps | Inspection interval extended from two years to three after three-month snapshots showed no deterioration. | Comparable data and a documented decision to extend. |
The economics: calculate, do not assume
The brochure gives outcomes, not prices. It does not publish the cost of the monitoring systems, the cost of a cooling tower fan repair, or the cost of a cooling water pump inspection. Any payback calculation therefore has to use site data. The arithmetic is simple, and it is worth doing explicitly so that the assumptions are visible.
| Input | Symbol or value | Source or note |
|---|---|---|
| Number of cooling water pumps | N = 4 | Brochure case. |
| Current inspection interval | 2 years | OEM recommendation in the brochure. |
| Proposed inspection interval | 3 years | Brochure outcome after three-month snapshots. |
| Inspection cost per pump | C | Site-specific: labor, parts, seal kit, crane or rigging, outage and risk. |
| Fewer inspections per pump over six years | 1 | Six years divided by two equals three inspections; six divided by three equals two. |
| Annual avoided inspections across the fleet | N / 6 = 0.67 | Four pumps, one fewer inspection each per six years. |
The annualized inspection saving is therefore N × C / 6. If an inspection including downtime and risk costs USD 25,000, four pumps avoid about USD 16,700 per year on average. That is an illustrative calculation with a hypothetical cost, not a brochure figure. If the inspection requires a pump changeout with crane and rigging, or if it forces a unit derate, C can be much larger; if it is a minor seal inspection during a routine outage, C can be much smaller.
The fan case is a loss-avoidance calculation rather than an interval calculation. The brochure reports more than USD 300,000 in losses before permanent monitoring and no further failures afterward. It does not state the observation period, the number of fans, or whether the USD 300,000 was a single event or a series of events. A defensible business case should therefore use the formula: avoided loss = event frequency × event cost × confidence. If the plant believes a destructive fan event would occur once every five years without monitoring, and the total cost is USD 300,000, the expected annual loss is USD 60,000. The monitoring cost is then compared with that expected loss, not with a guaranteed saving.
This is also where the pump and fan cases connect. The pump case buys time between inspections; the fan case buys protection against a low-frequency, high-consequence event. A plant that only funds the first will still be exposed to the second, and a plant that only funds the second will keep paying for unnecessary inspections. The portfolio argument is stronger than either case alone.
Common implementation mistakes
Copying alarm limits from a sister fan. A limit that is correct for one fan at one speed and one tower configuration can be too loose or too tight for another. Start from a baseline at comparable operating conditions and use the standard guidance as a frame, not as a substitute for the baseline.
Omitting the speed reference. Without a tachometer or keyphasor, blade pass, gear mesh and 1X cannot be normalized or separated cleanly. The result is a spectrum that looks detailed but is hard to trend.
Mounting on flexible covers or panels. A sensor on a removable guard or a thin panel measures the panel, not the bearing. Use a rigid mounting pad, a stud or a properly prepared surface, and route the cable with strain relief.
Treating three-month snapshots as continuous monitoring. A snapshot program is a periodic program. It can support an interval extension when the data are comparable and the failure modes are slow. It cannot replace continuous protection for a fast blade-crack failure mode.
Ignoring the gearbox high-frequency band. Gear mesh and bearing defects are often visible in acceleration long before they appear in overall velocity. A velocity-only fan installation can miss the earliest gearbox indication.
Extending an interval without a rollback trigger. An extension should have a defined condition that reverses it. Otherwise the decision becomes permanent by default, and the next inspection happens only after a failure.
Leaving alarms without an owner. A monitoring system that sends alarms to a screen nobody owns is a data logger, not a protection system. Assign the response, the escalation path and the review cadence before commissioning.
A 90-day implementation plan
| Phase | Days | Deliverable |
|---|---|---|
| Assess | 1–15 | Asset criticality ranking, failure-mode list, sensor locations, speed-reference availability, and a decision on which fans and pumps justify permanent monitoring. |
| Design | 16–30 | Channel plan, hardware selection, network and cyber review, spare-parts list, and an alarm philosophy with alert and danger levels. |
| Install | 31–45 | Sensor mounting, cable routing, rack and power installation, and a baseline collection at stable load and speed. |
| Integrate | 46–60 | System 1 configuration, Modbus or DCS mapping, alarm routing, operator training and a written response procedure. |
| Verify | 61–90 | Alarm tuning, a first data review, a documented baseline for each asset, and the first gate review for any pump interval extension. |
The 90-day plan assumes the plant already has a monitoring standard and a maintenance management system. If it does not, add a phase for data governance before the design phase. The most common schedule failure is not installation; it is the delay between commissioning and the first person who is authorized to act on the data.
Frequently asked questions
How much did the cooling tower fan failure cost?
The Bently Nevada combined cycle brochure reports that one plant lost more than USD 300,000 to cooling tower fan problems before installing permanent monitoring. In one cited event a blade sheared off completely, and the resulting unbalance destroyed the entire fan assembly and parts of the tower. The brochure does not itemize whether that single event accounted for the full amount.
Why did vibration switches and monthly checks not prevent it?
The brochure states that simple vibration switches were installed and a portable data collector was used monthly. Those measures did not prevent the blade failure. Switches typically act at a trip level, and portable checks are periodic, so damage can develop between visits. Neither method provides the continuous, speed-referenced trend that a growing blade problem requires.
What does permanent monitoring add on a cooling tower fan?
Permanent monitoring measures continuously at fixed locations. It can trend imbalance, blade-pass energy and gearbox condition, capture short transients, and alarm before a cracked blade becomes a released blade. It also removes the route-to-route variation in sensor placement and machine condition that makes portable trends difficult to compare.
Which sensors are used on cooling tower fans?
A typical fan set uses velocity sensors such as the 330500 Velomitor on motor and fan bearings, accelerometers such as the 330400 on the gearbox for gear mesh and early bearing defects, and a speed reference for order analysis. The 330500 covers 4.5 Hz to 5 kHz at plus or minus 3 dB, and the 330400 covers 10 Hz to 15 kHz at 100 mV per g. The brochure also lists wireless vibration monitoring for cooling fans.
How did System 1 extend cooling water pump inspections from 2 to 3 years?
The plant used System 1 to monitor bearing and seal vibration on four cooling water pumps in three-month snapshots. With no sign of deterioration, the OEM-recommended two-year inspection of bearings and mechanical seals was extended by one year, to a three-year cycle.
Is a three-year cooling water pump inspection interval safe?
It is defensible only with comparable snapshots, stable trends, stable seal leak-off and bearing temperature, a documented operating envelope, and a rollback trigger. The brochure reports one plant and four pumps. It is not a universal approval to skip inspections, and it does not replace the OEM conversation.
Can wireless monitoring replace permanent monitoring on cooling towers?
Wireless monitoring can be appropriate for lower-criticality fans, but the sampling interval must be shorter than the growth time of the failure mode. For a blade crack that can propagate quickly, continuous wired monitoring at the fan and gearbox is the safer choice. Wireless is a coverage tool, not a guarantee of protection.
What is the payback of permanent monitoring on balance-of-plant assets?
The brochure does not publish system prices, so payback must be calculated per site. The fan case documents a loss above USD 300,000 before monitoring, and the pump case removes one inspection per pump every six years. Use your own inspection cost, generation loss and event frequency to compute the annual value rather than applying a vendor percentage.
Related reading
- System 1 at 20 years and 10,000 users: what the installed base means for spares
- 3500 support status and the Orbit 60 transition
- 3500 spares planning through the RoHS PCBA refresh
- Orbit 60 fact sheet: 100 times processing and 65 channels
- Frac pump monitoring with 3500 VMS and vbOnline impact detection
For the application context, see gas turbine monitoring, steam turbine monitoring in power plants, and vibration monitoring for HVAC and data center cooling. The 3500/42M system page and the 3500/25 system page cover the module-level details.
Sources and method
This article is built from Bently Nevada’s combined cycle brochure and the product documentation linked above. The cooling tower fan and cooling water pump outcomes, including the USD 300,000 loss, the blade shear description, the four-pump scope, the three-month snapshots and the two-year to three-year extension, are reported in that brochure. The channel plan, the decision gates, the cost model and the implementation sequence are TenBN editorial analysis, not vendor claims. The brochure does not name the plants, publish system prices, or state the fan observation period.
- Bently Nevada, Power generation: combined cycle (brochure, 2023) — primary source for both cases and the other outcomes in this article.
- Baker Hughes, Condition monitoring for combined cycle power generation — application context and portfolio scope.
- Baker Hughes, Bently Nevada 3500 Machinery Protection Systems — platform and module context.
- Baker Hughes, 330500 Piezo-velocity Sensor — sensitivity and frequency range.
- Baker Hughes, 330400 and 330425 accelerometers — frequency range, sensitivity and API 670 reference.
- Bently Nevada, Celebrating 20 Years of System 1 — software context for the pump case.
Standards are referenced by name for orientation only. ISO 20816-3 provides evaluation guidance for industrial machines above 15 kW, and API 670 provides the machinery protection context for rack-based systems. Neither standard is a substitute for a machine-specific baseline, and neither prescribes a cooling water pump inspection interval.